A Sexy Look at X Blue Metrics for The Week Ending August 5, 2024
I'm beginning to see my X stats head upward again, and that's got me feeling sexy.
Here's the graphic that illustrates why I'm so damn sexy:
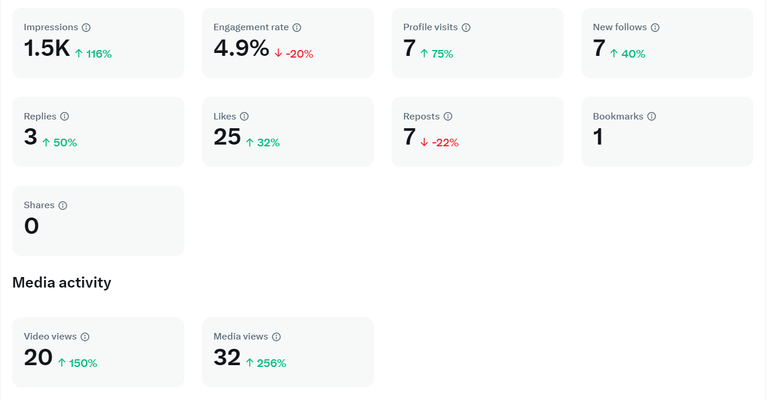
Impressions have bounced 116 percent. 1.5 thousand is still not great since I've had more than 3,000 impressions in a single week, but it does show that my impressions are climbing. A similar rise in the next seven days will put me back in the range that I'm used to seeing.
Other stats that are going up include:
- Profile visits (75 percent)
- New followers (40 percent)
- Replies (50 percent)
- Likes (32 percent)
- Video views (150 percent)
- Media views (256 percent)
I even managed to pick up a bookmark. I don't think I've seen that before. Is that a newly reported stat?
I managed to pick up 7 new followers this week, which puts me at 452 followers. I'm working hard to push that to 500. How soon can I get there?
In terms of stats on the downslide, only two metrics declined this week. The engagement rate fell 20 percent, but it's still at 4.9 percent, which is pretty high for me. Reposts dropped 22 percent and I still managed to pick up 7 of them. These stats are looking good.
Impressions and Engagements
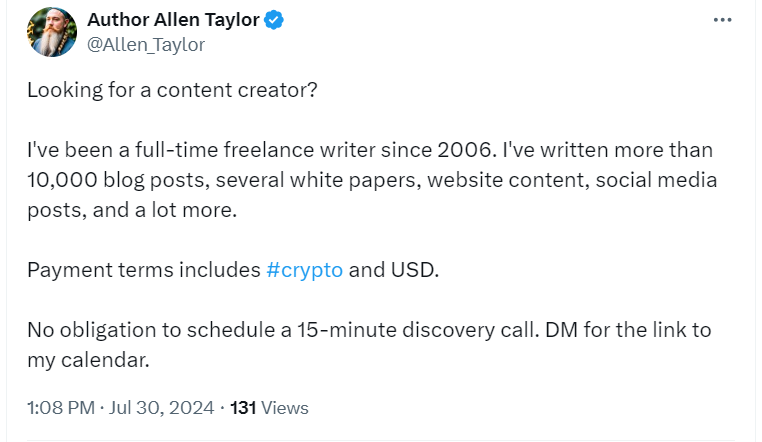
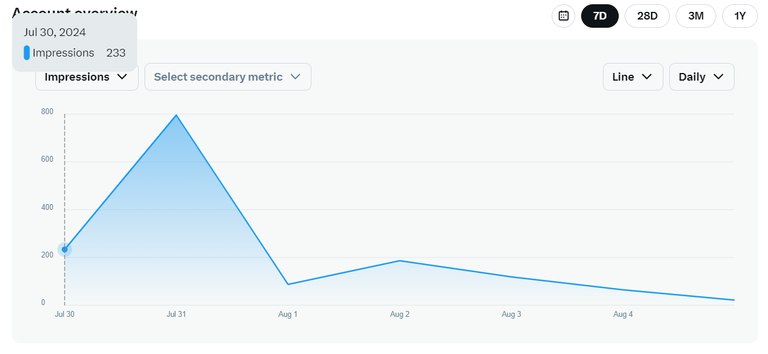
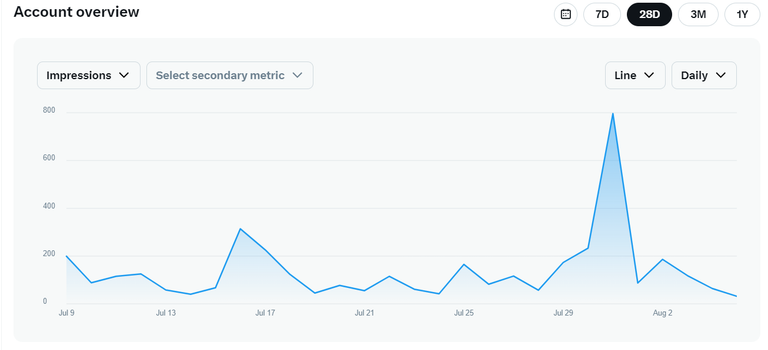
Impressions peaked on Wednesday, July 31. My posts saw 796 impressions on that day. They fell sharply the next day and remained fairly steady for the week. That got me looking for posts I made on that day and a couple of days before to see which ones saw the most impressions and engagements. Virtually all of my posts during those three days saw some action, and many of them saw respectable action. One post, however, stands above the rest with 131 views and several engagements.
Here's a look at the mountain peak of impressions:
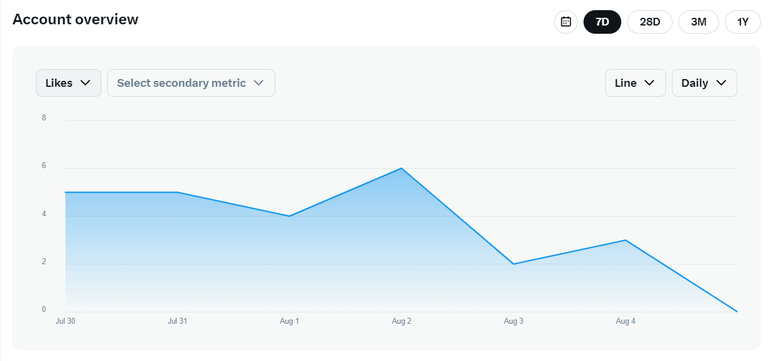
Likes were likeable this week too. Peaking on Friday, August 2, they were steady for most of the week. There was a sharp fall from August 2 to August 3, but it wasn't devastating. Still sexy.
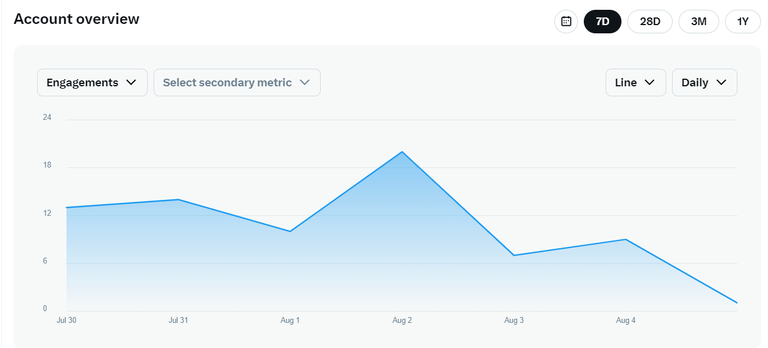
The Engagement picture looks very much like the Like picture. Peaking on August 2 with 20 engagements, there was a sharp fall on the next day. However, leading up to the peak, there was a steady flow of engagements that looks really sexy.
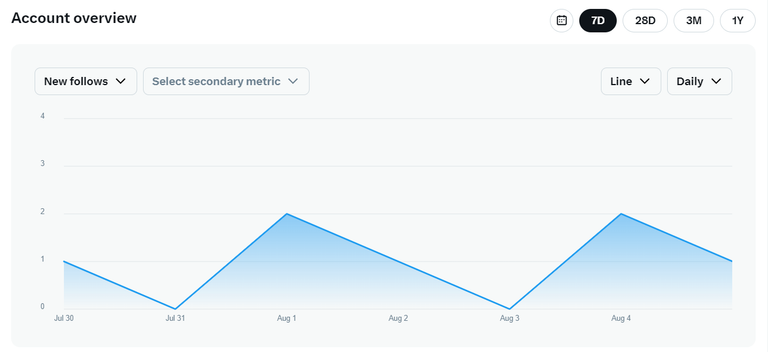
The New Follows metric looks like a ping-pong table. Serve!
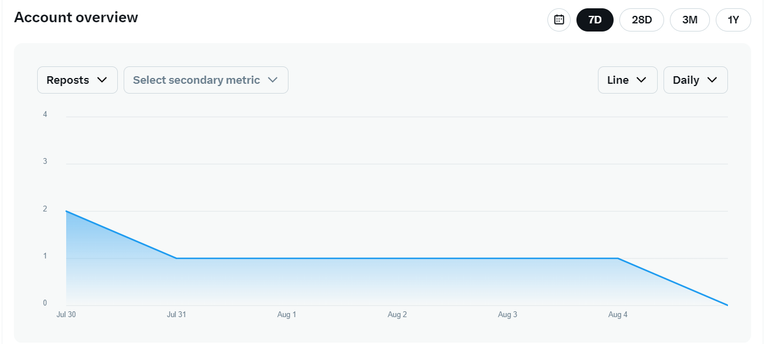
Reposts remained steady for the entire week. This is a nice little fishing pier.
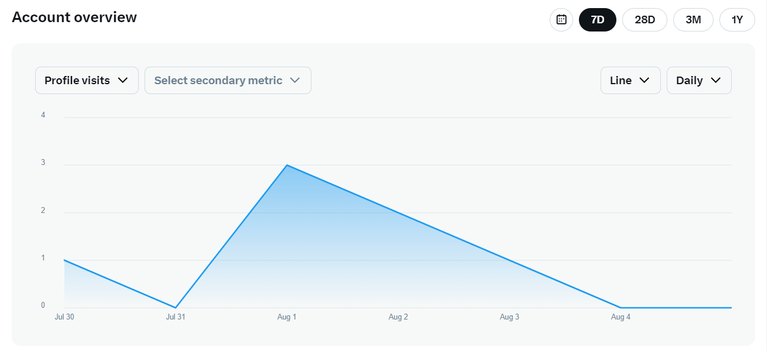
Profile Visits peaked on Thursday, August 1. A nice, steady decline follows through Sunday, August 4.
The 28-Day Picture
If we look at the past 28 days, we can see just how sharply the rise was this week. Here's a look at the 28-day Impression metric graph.
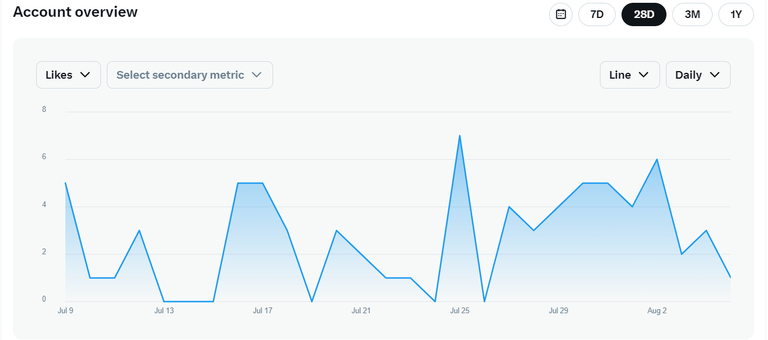
Likes were a bit more volatile.
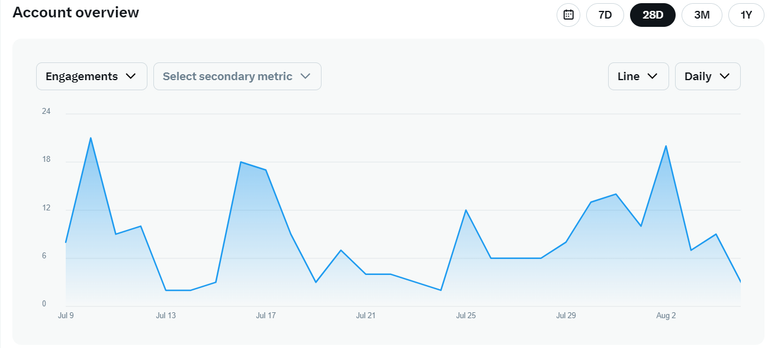
Engagements were strong in early July and dipped between last month and now. Peaking at 21 on July 10, they were at 20 on August 2. Not a bad recovery.
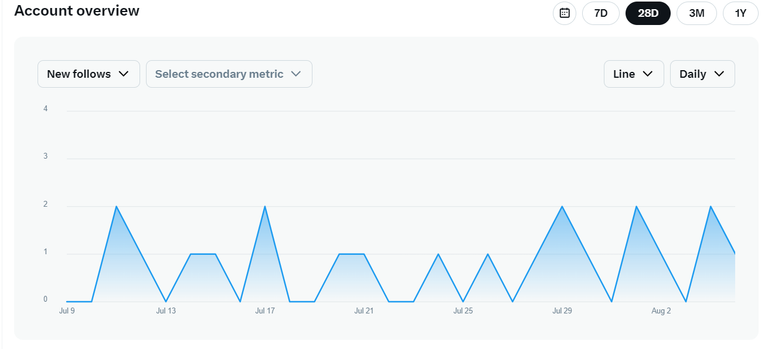
New Follows look like a mouthful of canine teeth.
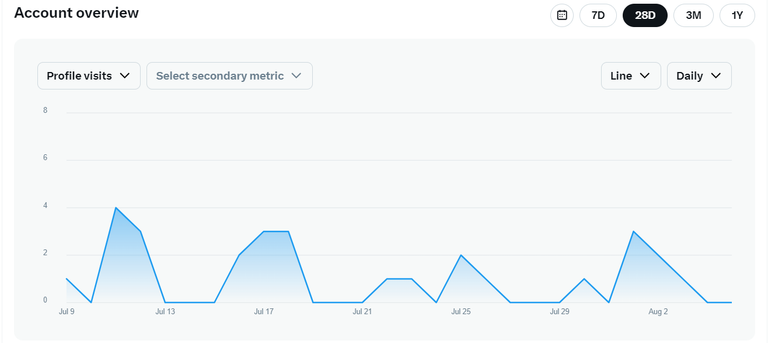
Profile Visits look like a smaller version of Engagements.
That's my report for this week. A nice recovery picture, but the real tell will be what happens in the next week. See you then.
Posted Using InLeo Alpha