Bitcoin and Hive (basic) Chart Technical Analysis. My TA's, the risks of Bad Advice and some of the Trading Tools I use!
Not Financial Advice : $HIVE and $BTC
Hello everyone. I like to keep an eye on only two crypto charts, using the free trading tools on Binance, those charts being $HIVE and $BITCOIN. I am not a day trader although I do take advantage of HUGE spikes (pumps) or dips (dumps) in the charts when I see an obvious trading opportunity. The last time I traded $HIVE for $HBD was 4th February 2023, when Hive hit $0.628, otherwise I have been happy to HODL (hold and accumulate) $HIVE.
As I often post my Technical Analysis (TA) on the THGaming and Pimp Discords I thought I might share them on Peakd as well. Later on in this post I explain why I don't often post TA's publically, so please read through that section thoroughly, and if you disagree with my TA's please let me know why in the comments as I am always learning and like to hear other opinions!
The S&P 500
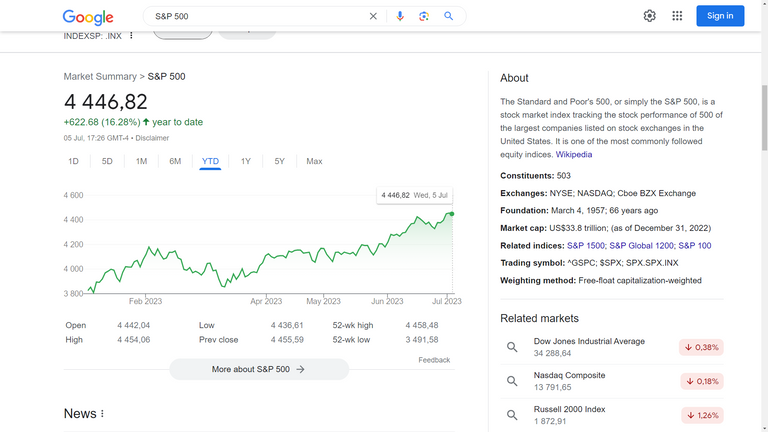
Why has Crypto, and Bitcoin in particular, trended up this year? Well it could be a result of the wider markets and there is no better way of ascertaining the global stock markets then the Standard & Poor's 500 Index (S&P 500). As you can see in the chart below there has been a steady uptrend in the S&P 500 this year, and with it we've seen Bitcoin climb from $16500 (1 Jan 2023) to $31500 (6 July 2023). As global markets improve, investors have more capital at hand for 'riskier assets' such as cryptocurrencies and are more inclined to invest in speculative high risk stocks (Bitcoin, Ethereum, Hive etc).
The Bitcoin Chart
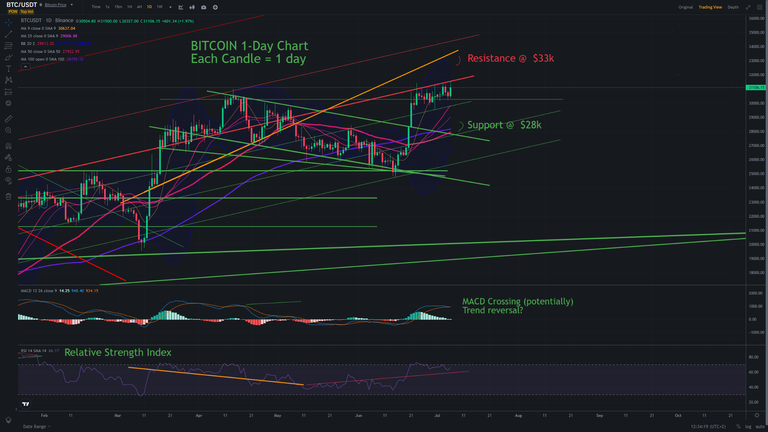
Here is the $BITCOIN Chart with the two largest Support and Resistance levels to watch. We have seen a lot of gains recently so some pull back is expected, although we did see a correction from 19th April to 15th June this year, so perhaps the bullish trend will continue? I'll be keeping an eye on the charts as always but with the sideways movement we will soon see a squeeze occurring so significant movement in either direction can be expected.
The Hive Chart
It looks like $HIVE is at a 'trade sideways level' for now and is likely to start moving up or down in the next few days. I have put my Support and Resistance levels and the areas that I think will be 'touched' by HIVE. If BITCOIN Continues to trend up, as it currently is, then we'll likely see $HIVE hitting the $0.36/37 level before finding resistance...whereas a bullish HIVE breakout could see a $0.39-$0.44 spike. The $0.27-$0.30 Levels were great support for HIVE last month so those are the support lines to keep an eye on. As always you also need to watch Bitcoin to ascertain the Wider Crypto Markets...a HUGE bitcoin Pump or Dump will result in the same correlating movement for HIVE.

2023 Trading Strategies
Today I would like to talk to you about a contentious topic : that of investing and the 'tools' I use to analyze the charts. Occasionally I post my Technical Analysis on the Hive and Bitcoin charts, but not too often. I will be listing SEVEN REASONS I don't post about this topic regularly, and why I think you should never make financial decisions based on someone else's article, technical analysis, video, or tweet :
The risks of 'bad advice'
Technical Analysis (TA) is not an exact science. It is an analysis of market trends and global financial movements, and even experienced Technical Analysts make bad calls when the Markets move in an unexpected way. Nobody can predict Chart movement 100% right every time; if this was possible then that person would become the richest person in the world, able to accumulate capital permanently, either through a Long or Short trade.
Technical Analysts commonly say "this is not financial advice" but people don't always listen to these words. I fear that people may read my 'predictions' and make financial decisions that do not go well for them. Either the crypto they buy goes down, or they sell too early and end up losing out because the stock price keeps climbing. It is a strange feeling looking at a chart in a technical way as even when I decide on my forecasted "highs and lows", there is always a niggling feeling that I could be completely wrong. As I said, nobody knows 100% what will happen in TA.
Experienced traders have their owns TA tools which they will use regularly to ascertain which direction they assume a stock price will move in. I am not personally day trading right now, although I did in the past. My worry is that inexperienced traders or new crypto investors may read my TA's and because I seem to know more than them, they'll make decisions based on my predictions. This could be reinforced by them also watching a YouTube video or seeing a Tweet that mentions similar analytics. Positive reinforcement from multiple sources often leads one to believe in that information; which again, is just an educated guess!
Market Manipulation in crypto is high, and we are still in a Bear Market (high sell pressure dominates global markets). If you look at the charts a favourite tool that analysts use are Moving Averages (MAs) which show the low, middle and high 'average prices' in which people are buying and selling a Stock / Crypto. These MAs often show where the price will find Support (which will move it up) or Resistance (which will move the price down). Its often the case that stock prices find support or resistance JUST BEFORE reaching a Moving Average, showing that experienced traders and 'whales' have ascertained these points and are reacting just BEFORE the apparent MA price point is reached. This means that a prediction can often fall just short of reaching the price point that it 'should hit'.
I am a self taught trader and as I mentioned I do not 'day trade' at this time. This means my TA predictions are for my own educational purposes. I began crypto trading in March 2020 with some success, but when the Bear Market hit it became a lot harder to predict price movements with my limited knowledge and inexperience of what to do when prices are constantly falling. I am learning every week and eventually I would like to create a portfolio of crypto and stocks, in which I actively trade. Having no formal training in TA, or years of experience to draw upon, I realize my own shortcomings and would hate for someone to lose based on 'bad information' from me.
Experienced traders get it wrong. There are a few Youtubers I watch every week, guys with many years of experience and advanced degrees in Trading, and even these analysts are often wrong. I mostly watch them for a 2nd opinion and also to learn about new trading techniques, but when I see them making bad calls I realise that I am under qualified to be directing other people's portfolios. Most analysts will be able to predict Price Movement but few will say definitively whether a stock will go UP or DOWN, they can merely tell you WHEN something big will happen and not HOW this movement will play out.
I am all in on Hive and THGaming, which means I am looking at the long term Hive price and building up @thgaming Guild to become a 'household crypto name' synonymous with play2earn crypto gaming across multiple chains and game ecosystems. As Crypto gaming evolves -lets be honest we have a long way to go before AAA games are consistently developed on blockchains- so too will our Guild continue to grow and develop, and when the hundreds of millions of gamers around the world start to convert to crypto and NFT gaming we will be there to provide a home and infrastructure for them to play within.
Those are some of the main reasons I don't overly post crypto analytics. However I do believe that we should all be educated about crypto TA if we are involved in the industry. Cryptocurrency is still in its infancy and is far more speculative than traditional stocks. We've seen giants fall this 'crypto winter' cycle and it's likely that more bad news is still to come. With all of that being said, here are some of my favourite tools for crypto trading.
Trading Tools
I use the free trading tools on Binance Exchange, but many crypto exchanges have these tools and often you don't even need to sign up (login) to use them. Here are some of my favourite Technical Analysis tool, many of which are available on the Binance Mobile App.
Bollinger Bands and the power of the Equilibrium Point.
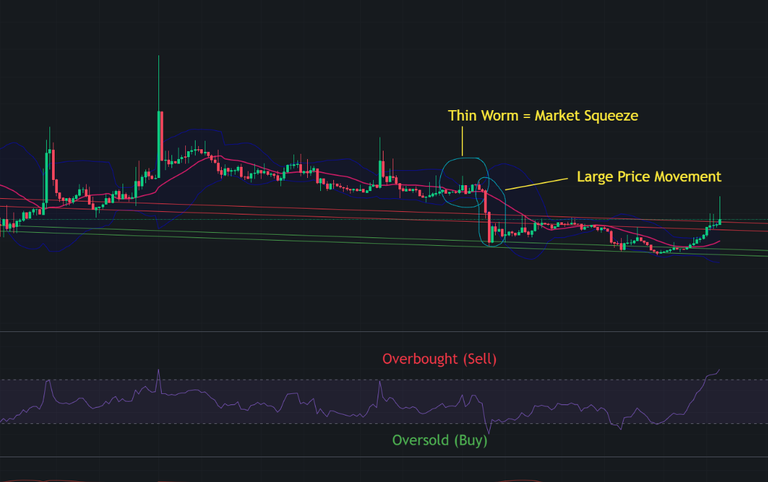
A Bollinger Band will show the volume that a stock is trading at, giving a visually presented 'worm' which is thick when the volume is high and thin when the volume is low. Trading volume represents how much of that stock is being bought and sold...usually the direction will be moving UP or DOWN when volume is high. When the Bollinger 'worm' starts to get thin, this shows that a market 'squeeze' is occurring, where buyers and sellers appear to agree on a very close price : an Equilibrium Point is reached. Before long a large movement up or down will occur as the stock price must move in one direction or another, and either the buyers or sellers will win. Market squeezes are always great points to look for in trading as they indicate that price movement is about to happen.
The Wedge Formation.
This is another visual tool that is plotted out by market analysts, looking for high and low buy + sell points which converge into a triangle like 'wedge'. The point of this Wedge indicates a market squeeze (Equilibrium Point) and helps to determine WHEN a price squeeze is likely to break out. Very handy when used in conjunction with Bollinger Bands.
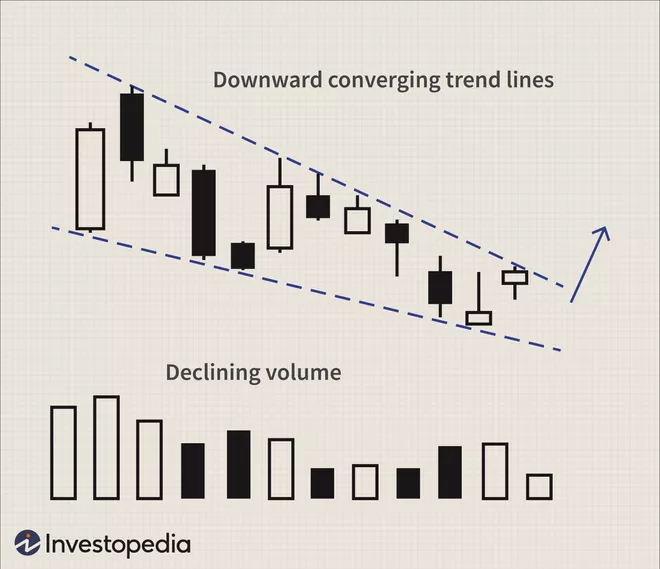
Here is a post I wrote on the 14th October 2022 when I was Tracking a Wedge on Bitcoin which did break out as predicted, however the FTX Crash in November undid all Bitcoin gains and saw a huge crash in the crypto markets, as investors lost confidence in Centralised Financed Exchanges and started pulling their money out and selling for USD.
Smart Moving Averages (SMAs)
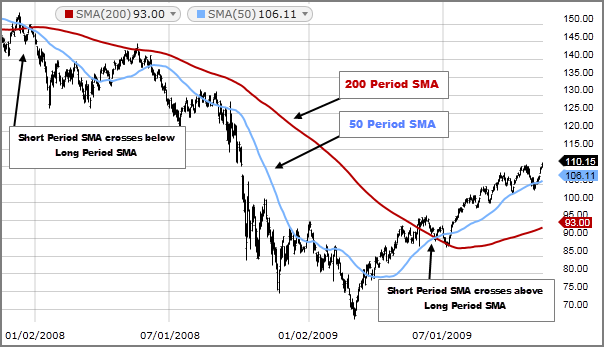
SMA's are Short, medium or long-term price averages in which people are buying or selling a stock, averaged out over a specific time period. As mentioned these serve as resistance or support lines for the stock price. Moving Average settings can be tweaked for specific trading strategies (based on the average over a certain number of days). Shorts term day traders may use the 9-day SMA, whereas long term traders will likely be focused on the 100 or 200-day SMA. I personally use the 9-day, 25-day, 50-day, 100-day Moving Averages when looking at the Bitcoin charts, for educational reasons only.
Relative Strength Index (RSI)
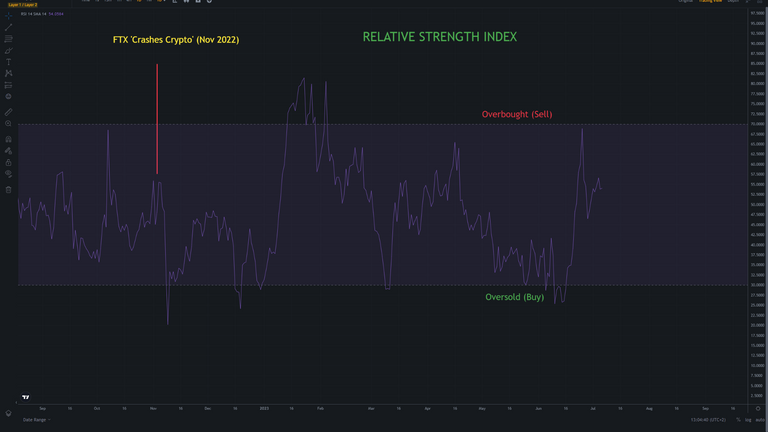
This show the Buy and Sell pressure of a stock, where one should be looking at the stock to determine if it is Overbought or Oversold and ready for a Trend Reversal. An RSI over 70% is considered overbought and likely to submit to selling pressure (go down) soon. An RSI under 30% is considered oversold and is likely to rise soon. RSI points can fall drastically below the 30% threshold or high above the 70% threshold before moving significantly...as seen below.
Moving Average Convergence/Divergence (MACD)
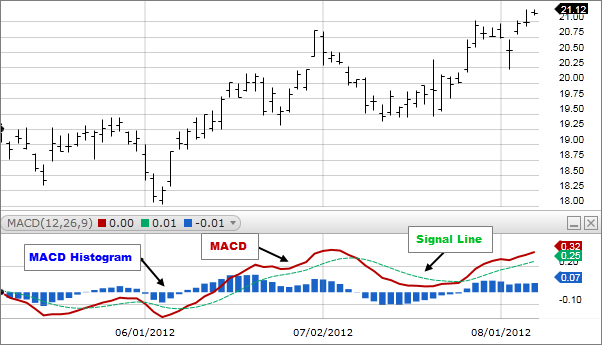
I also utilise the MACD indicator although I often find it to be a 'lagging indicator' meaning it is only recognizable after significant movement has already been made by the stock. The basic premise is to look for the MACD line and Signal line to cross, which indicates a trend change, however sometimes this cross can be short lived and quickly cross the other way. The MACD does shows the relative 'bearish' or 'bullish' trend very well when used in conjunction with the other trading tools mentioned.
With all that being said, those are my most used trading tools, which I've tried to explain in plain English. If you're new to crypto trading I'd recommend learning about each tool individually and getting to grips with what they indicate and how to use them: there are a ton of resources online so use Google! All of these tools are customizable and work on all charts no matter the timeframe; so they can be used on the 4-hour, 1-day, 3-day, 1-week or 1-month charts, or any timeframe between.
Trading Tools will always work best when used together so learn at least three (or more) TA Tools before starting to make any 'predictions'. It's such a great feeling when your TA's start to come true, but remember nobody is right all the time so be prepared to be wrong and make bad calls a lot, especially when Market Manipulators (or the SEC) gets involved. Finally, and most importantly, don't invest anything you aren't willing or able to lose!
Thanks for joining me in my Gaming and Crypto journey. As always...
Trade safely, Game hard.
THE END

THGaming Hive Community
Linktree Official - All Social Media links

Interesting reflection with the S&P
!PIMP
!PGM
!WINE
BUY AND STAKE THE PGM TO SEND A LOT OF TOKENS!
The tokens that the command sends are: 0.1 PGM-0.1 LVL-0.1 THGAMING-0.05 DEC-15 SBT-1 STARBITS-[0.00000001 BTC (SWAP.BTC) only if you have 2500 PGM in stake or more ]
5000 PGM IN STAKE = 2x rewards!
Discord
Support the curation account @ pgm-curator with a delegation 10 HP - 50 HP - 100 HP - 500 HP - 1000 HP
Get potential votes from @ pgm-curator by paying in PGM, here is a guide
I'm a bot, if you want a hand ask @ zottone444
You must be killin' it out here!
@enginewitty just slapped you with 1.000 PIMP, @jim-crypto.
You earned 1.000 PIMP for the strong hand.
They're getting a workout and slapped 1/4 possible people today.
Read about some PIMP Shit or Look for the PIMP District
Great post! I used to trade in the local stock market. I used some of those tools. I have also tried MACD which works like magic. When I traded crypto, i had some successes until SEC stepped in and messed with $XRP. Anyway, life goes on. I am glad I found #hive and got a piece of it. Thanks for this article bro👍 !PGM
BUY AND STAKE THE PGM TO SEND A LOT OF TOKENS!
The tokens that the command sends are: 0.1 PGM-0.1 LVL-0.1 THGAMING-0.05 DEC-15 SBT-1 STARBITS-[0.00000001 BTC (SWAP.BTC) only if you have 2500 PGM in stake or more ]
5000 PGM IN STAKE = 2x rewards!
Discord
Support the curation account @ pgm-curator with a delegation 10 HP - 50 HP - 100 HP - 500 HP - 1000 HP
Get potential votes from @ pgm-curator by paying in PGM, here is a guide
I'm a bot, if you want a hand ask @ zottone444
Appreciate the support! Yeah trading isn't for the light hearted 😁
!PGM
!LOLZ
!PIMP
You must be killin' it out here!
@jim-crypto just slapped you with 1.000 PIMP, @mdasein.
You earned 1.000 PIMP for the strong hand.
They're getting a workout and slapped 1/1 possible people today.
Read about some PIMP Shit or Look for the PIMP District
BUY AND STAKE THE PGM TO SEND A LOT OF TOKENS!
The tokens that the command sends are: 0.1 PGM-0.1 LVL-0.1 THGAMING-0.05 DEC-15 SBT-1 STARBITS-[0.00000001 BTC (SWAP.BTC) only if you have 2500 PGM in stake or more ]
5000 PGM IN STAKE = 2x rewards!
Discord
Support the curation account @ pgm-curator with a delegation 10 HP - 50 HP - 100 HP - 500 HP - 1000 HP
Get potential votes from @ pgm-curator by paying in PGM, here is a guide
I'm a bot, if you want a hand ask @ zottone444
lolztoken.com
Steal her blanket.
Credit: reddit
@mdasein, I sent you an $LOLZ on behalf of @jim-crypto
(1/10)
ENTER @WIN.HIVE'S DAILY DRAW AND WIN HIVE!
Congratulations @jim-crypto! You have completed the following achievement on the Hive blockchain And have been rewarded with New badge(s)
Your next target is to reach 30000 upvotes.
You can view your badges on your board and compare yourself to others in the Ranking
If you no longer want to receive notifications, reply to this comment with the word
STOPCheck out our last posts:
Great analysis, interesting times in the market. Lots of opportunities around.
Thanks. I see HIVE and BTC have just dropped quite a lot! Crazy times indeed 😁
!PGM
!LOLZ
!PIMP
You must be killin' it out here!
@jim-crypto just slapped you with 1.000 PIMP, @mypathtofire.
You earned 1.000 PIMP for the strong hand.
They're getting a workout and slapped 1/1 possible people today.
Read about some PIMP Shit or Look for the PIMP District
BUY AND STAKE THE PGM TO SEND A LOT OF TOKENS!
The tokens that the command sends are: 0.1 PGM-0.1 LVL-0.1 THGAMING-0.05 DEC-15 SBT-1 STARBITS-[0.00000001 BTC (SWAP.BTC) only if you have 2500 PGM in stake or more ]
5000 PGM IN STAKE = 2x rewards!
Discord
Support the curation account @ pgm-curator with a delegation 10 HP - 50 HP - 100 HP - 500 HP - 1000 HP
Get potential votes from @ pgm-curator by paying in PGM, here is a guide
I'm a bot, if you want a hand ask @ zottone444
lolztoken.com
He told me to stop going to those places.
Credit: benthomaswwd
@mypathtofire, I sent you an $LOLZ on behalf of @jim-crypto
(1/10)