$HIVE and the Relative Strength Index (RSI) : cracking the code on trading?
No Certainties in Trading
I started writing this post about 3 weeks ago but didn't end up posting it. Due to the recent happenings in the market and particular with $HIVE, I wish I had posted it and also followed my own advice! Read on to see why I say this...
So first up it's important to let everyone know that there are no sure fire trading strategies in the world. There are hundreds of technical indicators one can use, and after a while you think "I know 100% what is going to happen!", you enter a trade and suddenly the opposite happens! There are many reasons for this occurring but in my mind there are two major reasons:
Trend analysis : Trading is based on trends and a trend can change or simply move against the grain with no warning. Meteorology (the study of weather) works in the same way, looking at the last 50 or 100 years in order to determine what will happen tomorrow or a month away. How often have you checked the weather report and it's been wrong? Trading is based on similar principles.
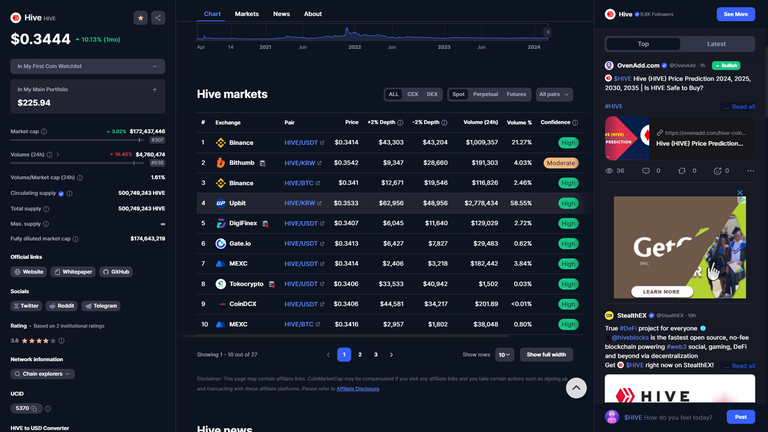
Market manipulation : Just when you think the graph is moving in the right direction (either up or down) suddenly it changes course due to a large influx or deflux of capital. The graph (price) moves quickly in one direction, only to return back to 'normal' quite quickly. In $HIVE trading we often see these market manipulations happen on the KOREAN exchange Upbit and nobody really knows which person or people are responsible for this. You can see in the picture below how high the volume is on Upbit compared to the other exchanges.

So with no 100% correct trading strategies, why am I writing this post? Well it's true that there are no trades that will ALWAYS be right based on technical indicators but that doesn't mean we shouldn't try. $BITCOIN and $HIVE are the two cryptocurrencies I follow on a daily basis and I dabble in technical analysis to try and figure out when a good time would be to buy or sell. The more tech analysis I do, the less sure of myself I am, a product of the Duning-Kruger Effect?!
I'd also caution warning to people watching and taking advice from 'Youtube Traders' who often claim to have a strategy with a huge success rate...you'll find that more often than not they'll be trying to sell you a trading course/subscription or a trading bot of some or other kind. If these social media traders have really cracked the code, they will be making so much profit they wouldn't need to create a 'trading course with a promo code' or have advertisers sponsoring their channels. I personally watch a few Youtube traders mostly to get a second opinion and/or to see which altcoins might be trending in the news.
(Above) Matt Kors is a strong trader and watches a lot of News reports on Stocks and Crypto. This is the only channel I watch almost every day for info, trends and entertainment value.
Bitcoin turns bullish
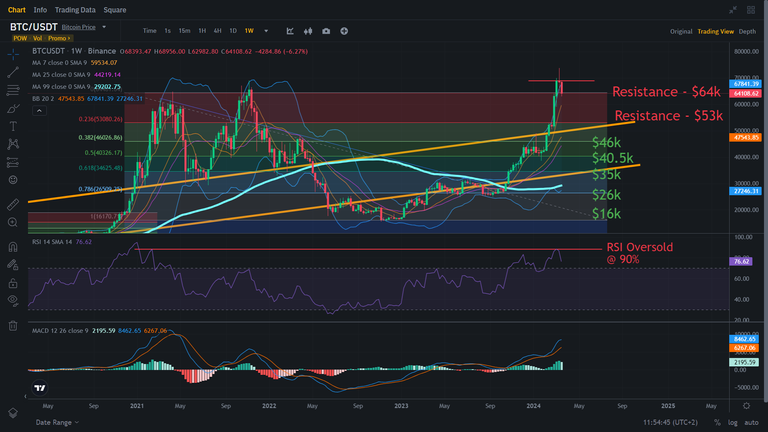
$BITCOIN has been a very difficult nut to crack, becoming so bullish (buyers winning, price goes up) after a long bear market (sellers winning, price going down), that it's hard to know just where it it will go from here. The good news is that in October 2023, Bitcoin broke above the 99-Day moving average (characterized in the Graph below by the worm-like thick blue moving average line), which is a strong indication of a bull market. There are 3 major reasons for this : (1) Bitcoin spot ETF approval (2) The upcoming Bitcoin Halving (3) Worldwide inflation and the adoption of digital currencies. One could also argue that the bear market was always going to reach an end and it was just a matter of time.

(Above) $BITCOIN weekly graph from 19 March 2024
Hive trading strategies
I will assume that if you're reading this you're simply looking for a second opinion OR you don't know anything about trading and just want to know what to do. As I mentioned before there are no certainties in trading and anything could happen. These are simply techniques I use, as a self taught technical analyst. Trends can change, technical tools can be wrong...that is why no trader worth their salt will ever say that they know what is going to happen. However I do believe that the Relative Strength Index indicator is a powerful tool on $HIVE, so if you're a trader I'd recommend using it in conjunction with the other tech indicators you use. Let's take a look at it below.

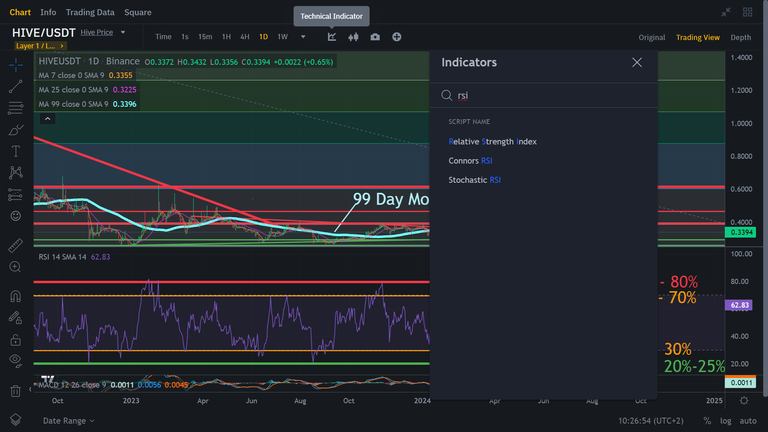
(Above) I use the free trading tools on Binance, but every crypto exchange has an RSI that you can use on the graph. Above you can see how to access this on www.binance.com (you don't even have to be logged in) by clicking on 'Technical Indicators' at the Top and the typing in "rsi" into the search window. Click it and the RSI (relative strength index) will be added to your Graph below it.
The green support lines, red resistance lines, orange 'maybe' lines, as well as all text were created by me, these do not come with the standard RSI.
Once the RSI has been added you will be able to see if the stock / crypto is currently Oversold or Overbought.
- Overbought means too many people are buying it and the price is likely to come down...this is a good time to sell...and is characterized by an RSI of 70% or higher.
- Oversold means too many people are selling it and the price is likely to go up...this is a good time to buy...and is characterized by an RSI of 30% or lower.

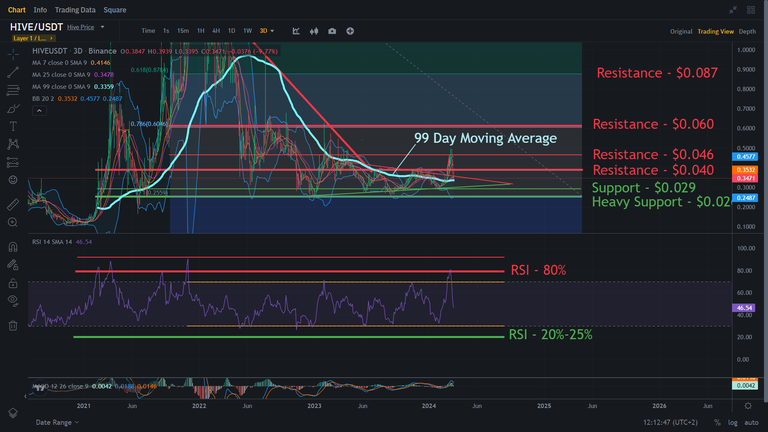
(Above) The $HIVE 3-day graph (each candle = 3 days) has been a very useful tool for deciding whether to buy or sell. Unfortunately these indicators can lag, meaning they only become apparent after something big has happened. But in general $HIVE is a definite sell at 80% RSI or higher, and is a must buy at the 20%-30% RSI mark.
The reason I mentioned that I should have taken my own advice at the beginning of this post, is that I've been telling people for weeks how the 3-day $HIVE graph is a definite sell at 80% or higher on the RSI, but decided not to take profits. The reason for this is that $HIVE can go a lot higher in the Bull Market and I was waiting to see if $HIVE would follow so many of the other #altcoins up with $BITCOIN, I mean we didn't know if $BITCOIN was going to keep pumping to $80k or higher. So the trade I took on $HIVE at 0.3175 was up 50% at one stage, and I did not trade it back to $HBD (Hive Backed Dollar). Now with $HIVE going down it seems like a bad move. That's the thing about trading, you never actually know where the Top or Bottom is, and the determining factor is often our own greed!
So in a nutshell I'd highly recommend adding the RSI to your trading arsenal and learning exactly how it works, as it has been very successful in predicting which way $HIVE will go. If you're a long term Hodler or Dollar Cost Averager, then taking profits is not going to be for you; but the RSI will still be able to show you the best times to buy into more $HIVE so is worth looking into for that reason.
If anyone has any questions or would like to share their own technical analysis / trading thoughts, be sure to comment on this post...or drop into the Market-Watch Channel in the THGaming Discord server and let's start a conversation. If you'd like to see some of the other TA Tools I use please 'Have a look at this Post from July 2023'.
Thanks for joining me in my Gaming and Crypto journey. As always...
Trade safely, Game hard.
THE END

THGaming Hive Community
Linktree Official - All Social Media links

!hiqvote
@thebighigg, the HiQ Smart Bot has recognized your request (3/3) and will start the voting trail.
In addition, @jim-crypto gets !PIZZA from @hiq.redaktion.
For further questions, check out https://hiq-hive.com or join our Discord. And don't forget to vote HiQs fucking Witness! 😻
RSI is a great indicator! I guess we're in a holding pattern to see where we go next on the charts!